
- Free
- Nothing uploaded
- PNG and SVG export
How to use it
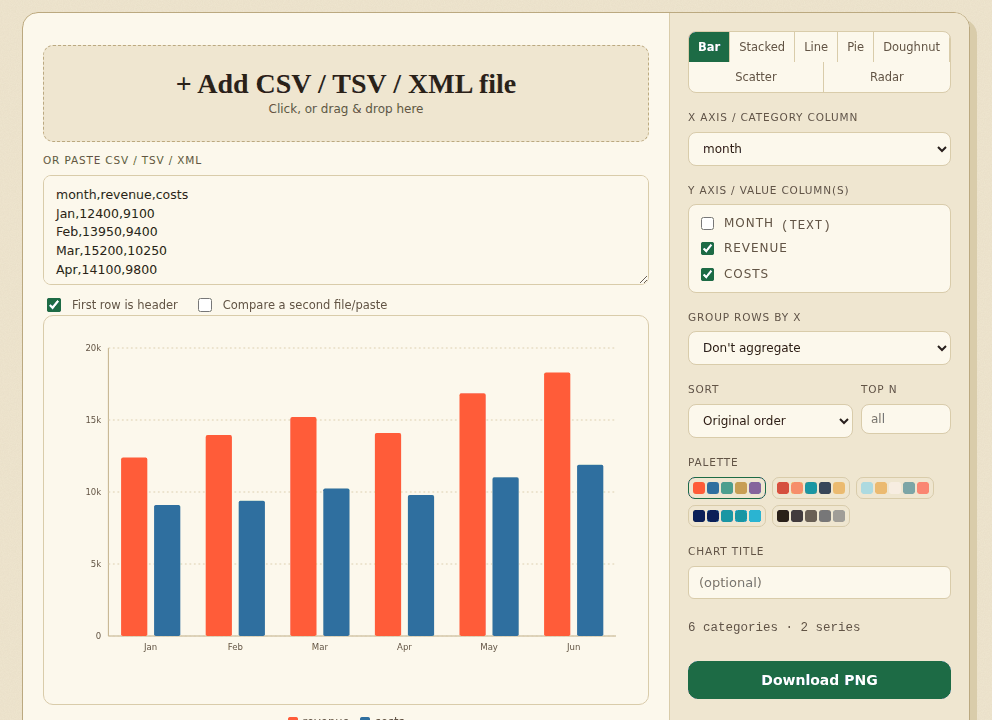
- Add your dataOpen a CSV, TSV or simple XML file, or paste the data.
- Choose a chartColumns are detected for you. Pick a type, the columns and a palette.
- DownloadSave the chart as PNG or SVG.
Good to know
Check that the right columns are used. Cells that are not numbers are drawn as 0, and the tool tells you how many. A value such as 12% is drawn as 0.12. A second file can be compared on line charts only. Saved images always have a white background.
Worked example: a monthly report
This CSV has a text column (month) and two number columns. The tool picks month as the X axis and draws revenue and costs as two series without any setup:
month,revenue,costs
Jan,12400,9100
Feb,13950,9400
Mar,15200,10250
Apr,14100,9800
May,16850,11020
Jun,18300,11900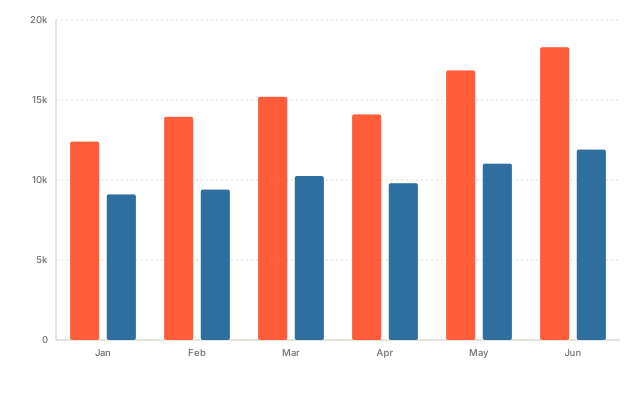
The SVG is 640 by 400 and the PNG is 1280 by 800 pixels, both on a white background. The legend is not part of the saved image, so name the series in your caption or in the chart title box.
How the tool reads your numbers
$1,000is read as 1000, and12%as 0.12.- A cell that is not a number is drawn as 0 and counted in a note. For a column with one
n/ain it the note reads: “1 cell in the value columns could not be read as numbers and is drawn as 0 (for example “n/a” in “v”).” - If the same X value appears on several rows, choose Group rows by X and Sum, Average or Count. A file with 200,000 rows and 40 different keys becomes 40 bars.
- Pie and doughnut use the first value column only, and a second file can be overlaid on line charts only.
Chart data in an Excel file? Export the sheet first with XLSX to CSV. To tidy the data before charting, use Remove duplicate rows.
How we tested this
On 31 October 2026 we ran the live page in headless Chromium on a Linux cloud server, driving it the way a person would (adding files, clicking the buttons, saving the download) and checking the files it produced.
| What we checked | Result |
|---|---|
| All seven chart types (bar, stacked, line, pie, doughnut, scatter, radar): the SVG is valid XML with a text label for screen readers and a white background, and the PNG is exactly 1280 by 800 | 35 of 35 |
| 30 random tables: the height of every bar in the SVG is in proportion to the number in the CSV, for 2 to 8 categories and 1 to 3 series | 30 of 30 |
| 10 random tables grouped by X with Sum, Average and Count (30 runs): each bar matches the figure we computed separately | 30 of 30 |
$1,000, 12% and n/a are read as described above and the note appears; no page errors; no requests to other sites | 5 of 5 |
| Total | 100 of 100 |
Not tested: Pie, doughnut, scatter and radar charts are checked for valid output only, not for the exact size of each slice or point. Grouping 200,000 rows into 40 bars took about 2 seconds in our run; your device will differ.
Frequently asked questions
Which chart types can I make?
Bar, stacked bar, line, pie, doughnut, scatter and radar. Pie and doughnut charts use the first value column only.
Is my data uploaded?
No. The chart is drawn in your browser and nothing is sent to a server. The page keeps a copy of the file you add on your device so it is still there after a reload, until you use Clear saved data in the menu. After your first visit the page also works offline.
Can I compare two files?
Yes, on a line chart. Tick “Compare a second file” and add it. Its lines are dashed and are matched to the first file by the X value. Other chart types do not show the second file, and the tool says so.
Which files can it read?
CSV, TSV (or semicolon or pipe separated text) and simple XML where each record is a repeated element. Excel files are not read here: export the sheet as CSV first, for example with the XLSX to CSV converter on this site. Files that are not UTF-8 are read as Windows-1252 and the tool tells you.
How are numbers read?
Thousands separators, a leading $, €, £ or ¥, and a trailing % are understood (12% becomes 0.12). In a semicolon-separated file a comma between digits is a decimal comma, so 1,5 is 1.5. Anything else that is not a number is drawn as 0 and counted in a note above the chart.
What does “Group rows by X” do?
It combines rows that share the same X value, using sum, average, minimum or maximum of the value column. Count (rows) counts the rows for each X value, whatever the value column holds. Scatter charts are not grouped.
How much data can it draw?
Bar, stacked, pie, doughnut and radar charts draw up to 4,000 values, and line and scatter charts up to 40,000. A bigger file is not drawn; the tool tells you to group the rows or set Top N. In testing, 200,000 rows grouped into 40 bars were drawn in a few seconds.
What is in the PNG and SVG?
The chart on a white background, whichever colour theme the page is in. The PNG is 1280 by 800 pixels. The legend is not part of the image.
Where to go next
- If the numbers are spread across files, merge them first.
- Repeated rows inflate totals, so remove duplicate rows before charting.
- To send the sheet and not only the chart, convert it to PDF.
When people use it
- A monthly report arrives as a CSV and you want a picture for a slide.
- You want to see at a glance which category in an export is the largest.
- You need a PNG or SVG chart without opening a spreadsheet program.